Data Flow Information & Insights
Nexla provides complete information about each data flow available to a user's account in an easily accessible information drawer.
The data flow information screen includes the Nexla Flow Insights feature. Flow insights allow users to quickly and easily view granular details about data flows, including flow metrics, run logs, and error information. For more about viewing and using Flow Insights in Nexla, see Section 4.
1. Data Flow Information Drawer
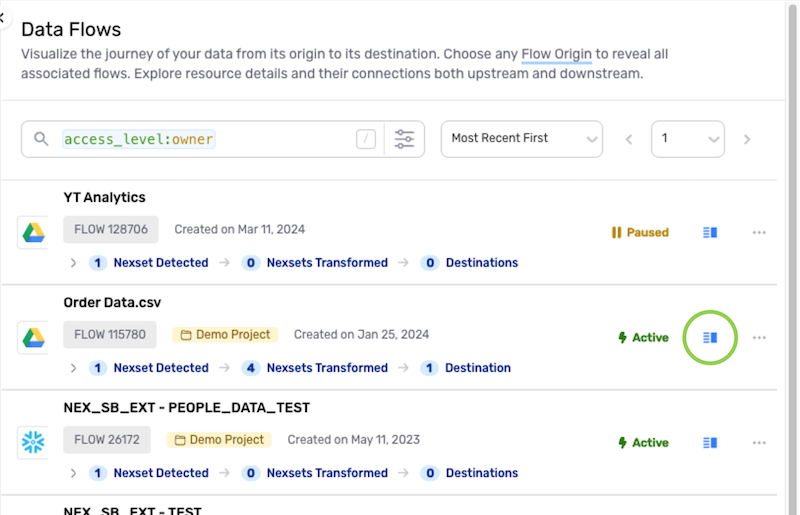
Data flow information can be accessed from anywhere a data flow is listed in Nexla, including the All Data Flows and Projects screens within the Integrate section.
To access the information drawer for any Nexset, click the ![]() icon on the data flow listing. The data flow information drawer opens on the right side of the screen.
icon on the data flow listing. The data flow information drawer opens on the right side of the screen.
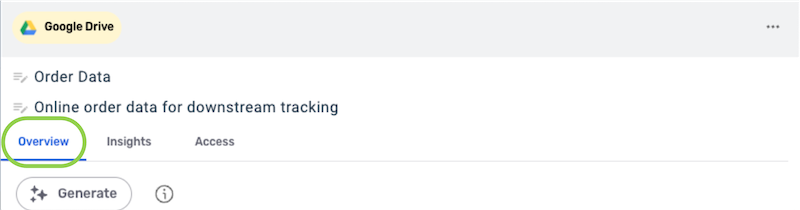
The top panel of the information drawer displays the data flow name and description, which can be edited directly within these fields. Any changes are automatically saved upon clicking outside of the field.
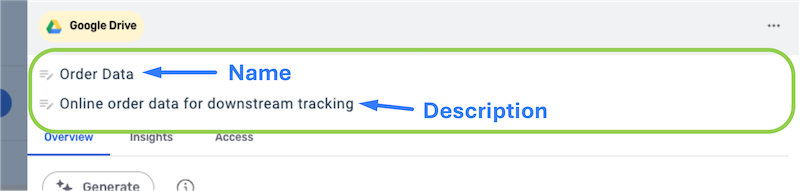
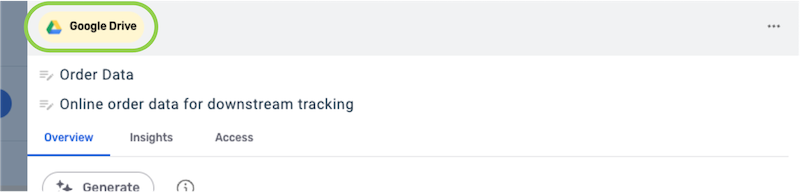
The tile at the top-left of the panel indicates the source connector type for the data flow.
Click the
 icon to access a menu of additional data flow functions.
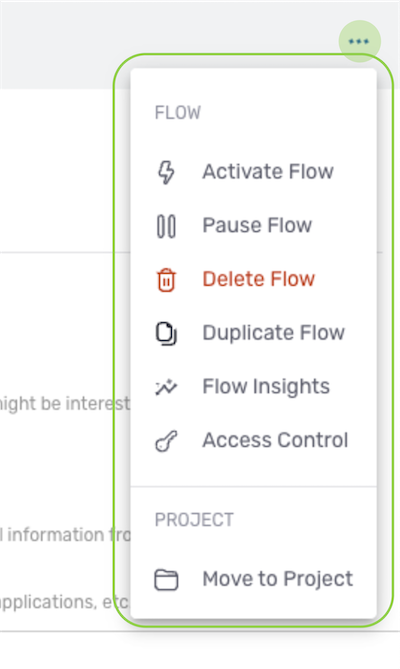
2. Overview Tab
The Overview tab displays a summary of information about the data flow.
Data Flow Documentation
Including meaningful documentation for resources in Nexla is important—it helps users better understand and apply resources and is crucial for efficiently triaging data flows.
Nexset documentation entries usually include the following types of information, which can be organied into any format to best suit the use case; however, this is not an exhaustive list, as Nexset documentation can include any information that enables effective understanding and usage of the Nexset:
- Description – General information about the data flow that can help users determine whether the data that it contains will be useful in their workflow/application
- Summary – Details about the data flow, such as its origin, attributes, & content and any applied transformations and/or enrichments
- FAQs – Answers to common user questions about the data flow, which can include information about the data freshness & quality, typical applications, usage notes, etc.
Data flow documentation can be viewed, entered, or edited within the text field at the top of the Overview tab.
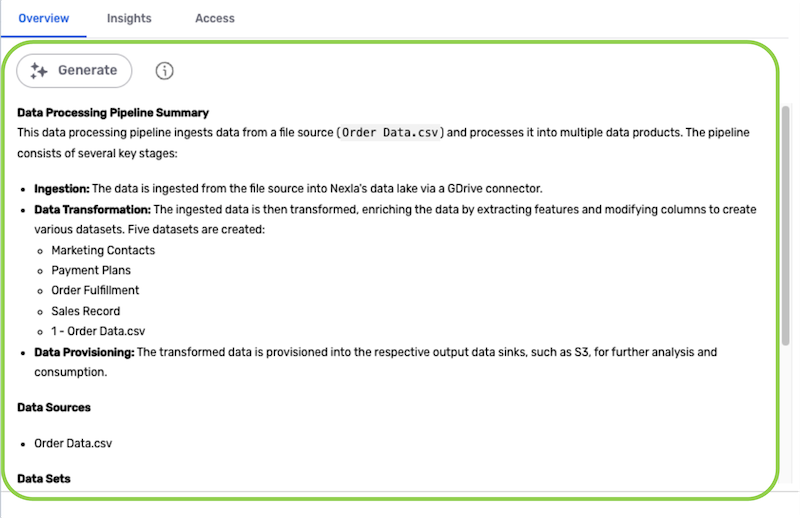
If GenAI integration has been enabled, the documentation field can be populated with AI-generated information about the data flow by clicking the
 button. Enabling GenAI Integration
Integrating GenAI services with Nexla requires a one-time setup process performed by an organization administrator. Once integration is enabled, all users in the organization will have the ability to add AI-generated documentation to resources.
To learn how to enable GenAI integration in Nexla, see Integrate Nexla with OpenAI or Integrate Nexla with Google AI.
Data flow documentation can be edited by clicking and typing directly within the text field.
To discard changes to the documentation text, click the
 button in the bottom-right corner below the text field.
To view a side-by-side comparison of text modifications, click
 in the bottom left corner below the text field.
 Side-by-Side Comparison
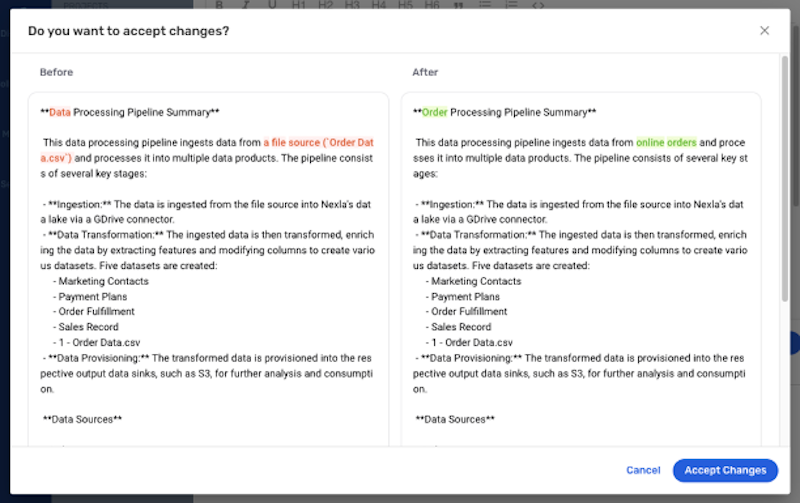
Text changes can be saved directly from this pop-up by clicking the
 button.
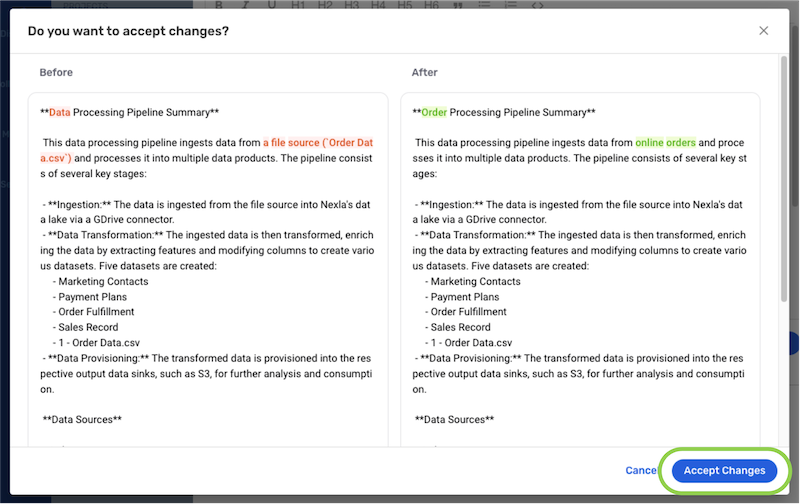
To reject text changes from this pop-up, click
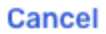 in the bottom-right corner.
To save the entered or edited documentation text:
In the resource information drawer, click
 in the bottom-right corner below the text field.
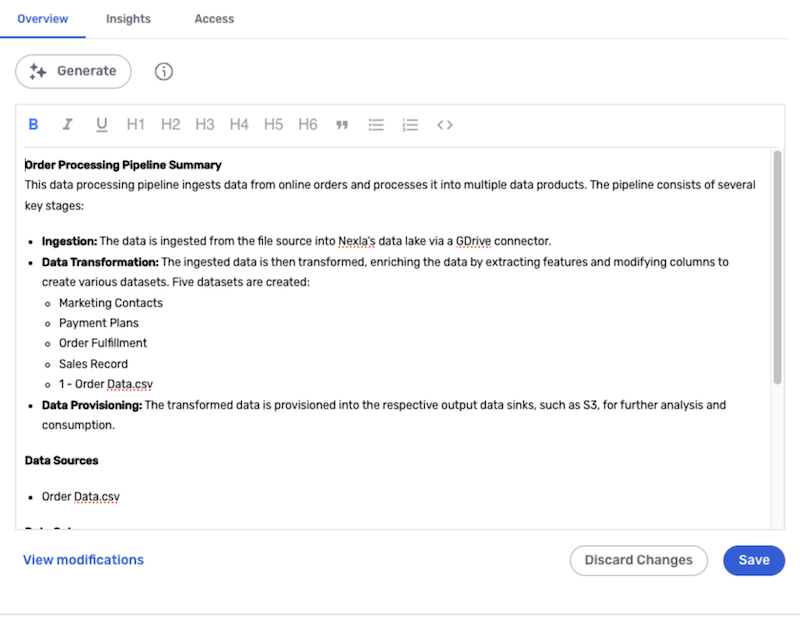
In the side-by-side text comparison, click the
button in the bottom-right corner of the side-by-side comparison pop-up.
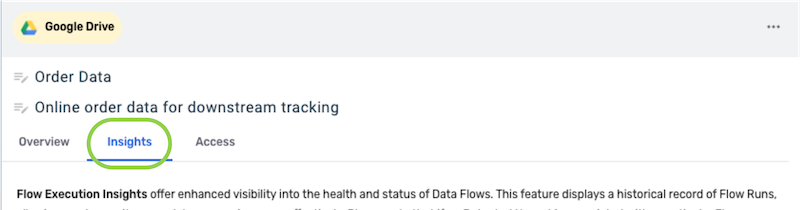
3. Insights Tab (Data Flow Insights)
The Insights tab displays flow execution insights—a historical record of each run of the data flow. Flow insights provide enhanced visibility into the the health and status of the data flow, enabling efficient and effective monitoring of data processing.
Records of each execution of the data flow are listed in the Insights tab.
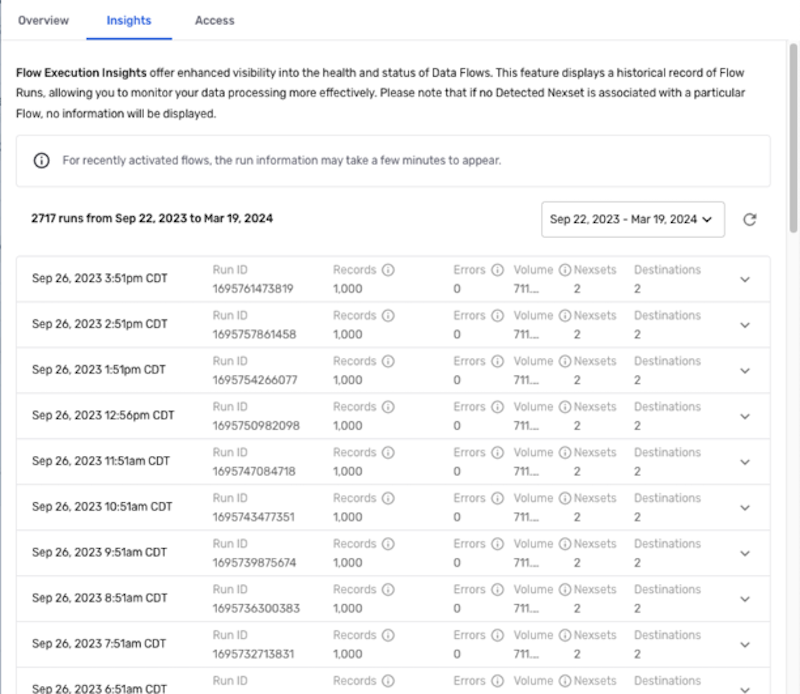
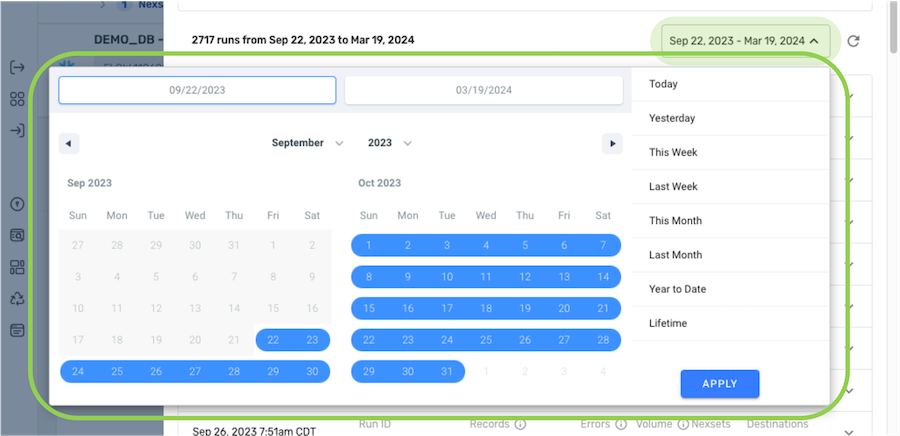
By default, the Insights tab lists execution records spanning the lifetime of the data flow. However, for some monitoring and triaging workflows, viewing records of data flow runs that occurred within a specific period is more effective.
The pulldown menu at the top-right of the list can be used to view execution records spanning a selected time frame.
Click
 to the right of a run to view information about that run according to the source, Nexset(s), and destination in the data flow.
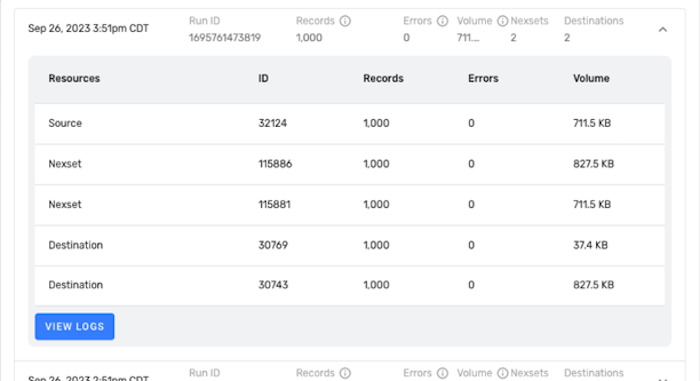
To view the detailed execution log for a run, click
 at the bottom of the expanded run record.
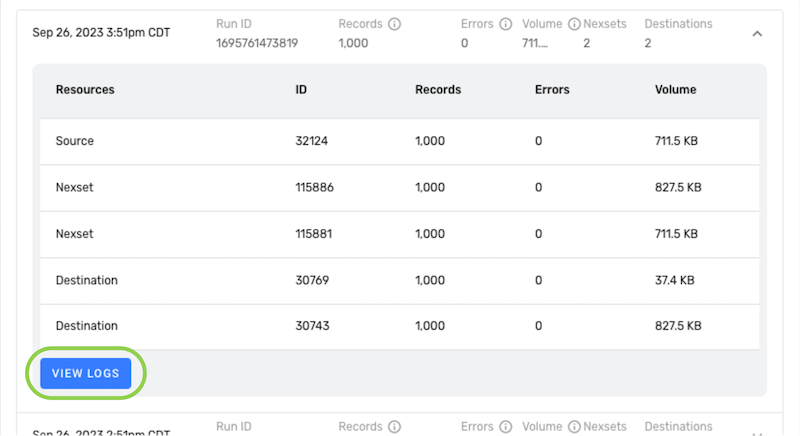
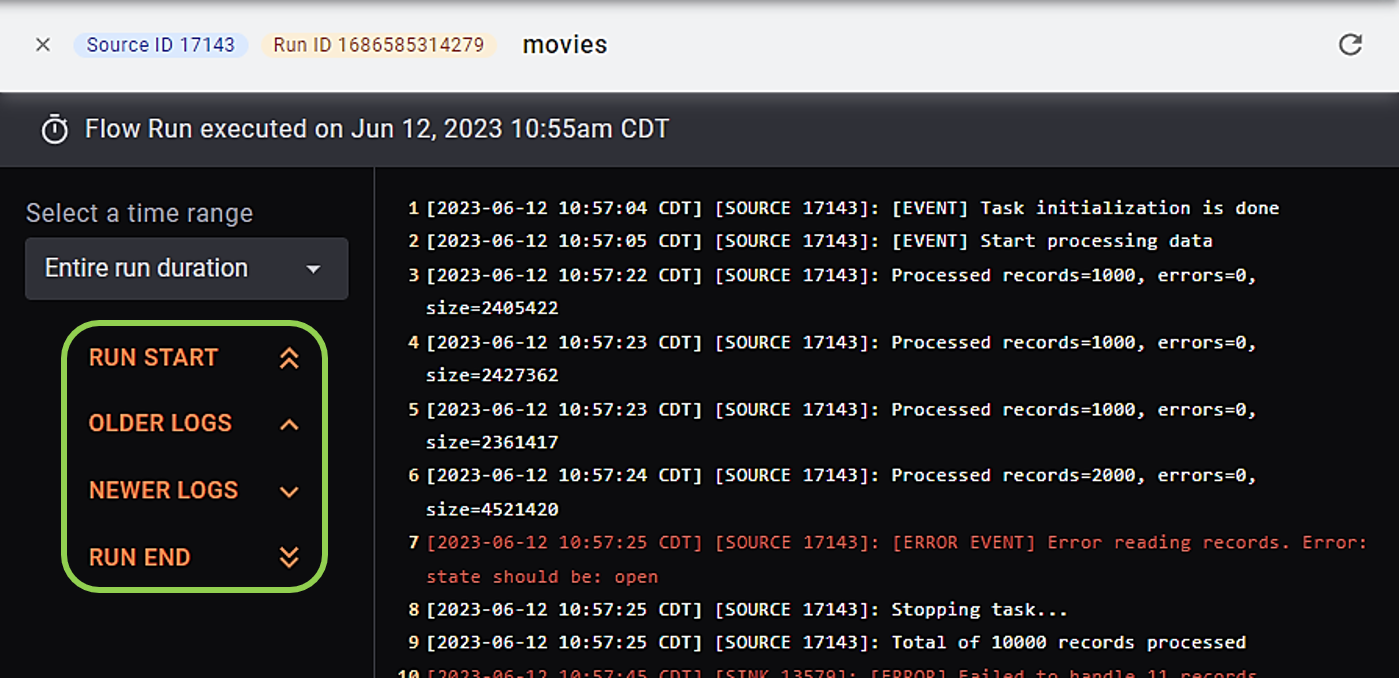
Run Execution Logs
Each run execution log provides detailed processing insights into Nexla's execution of the selected run, allowing users to easily monitor the progress of each component of the data flow. These insights include component-level data processing metrics and information about any errors that occurred during the run.
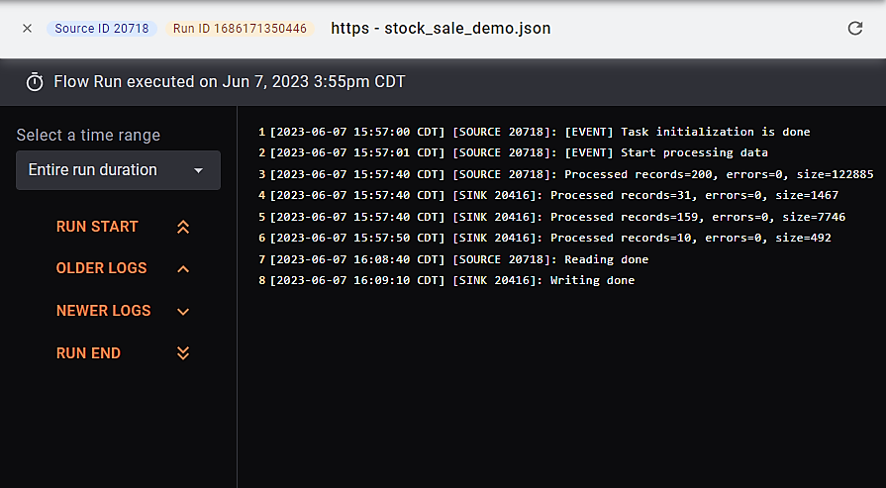
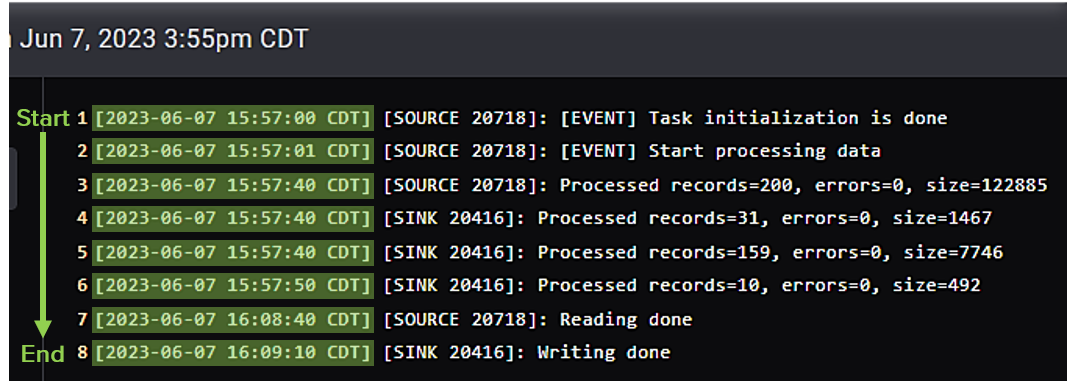
Within the run log window, log entries include datetime stamps and are listed in the order of occurrence, beginning with the run start at the top of the list and continuing to the run end at the bottom.
The Nexla ID of the flow component to which an insight corresponds is listed after the datetime stamp.

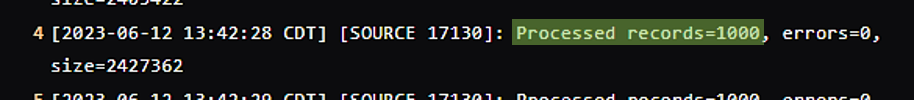
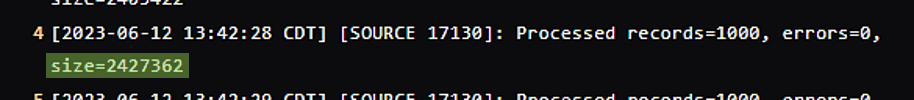
The following component-level metrics are provided for each component in the data flow during the run described by the selected run log:
Processed records – the total number of data records read from or written to the indicated component
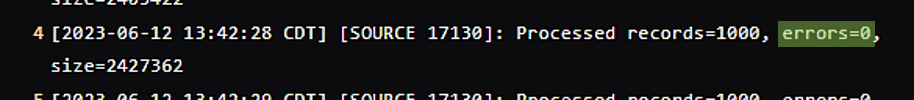
Errors – the total number of errors associated with the component detected during the run
Size – the total data volume read from or written to the indicated component
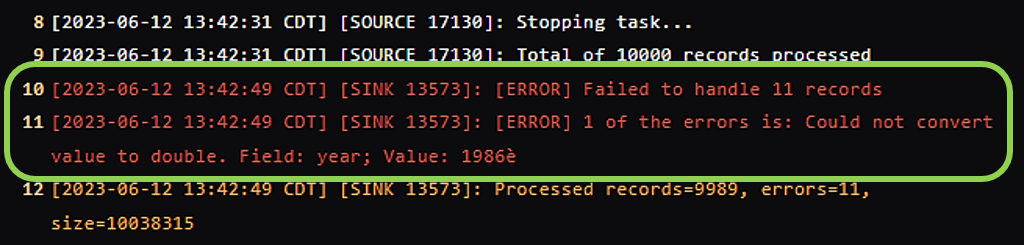
Error Insights
When an error is detected during a selected run, one or more run execution log entries will provide insight(s) into why the error occurred as well as the associated run component and any affected records.
Run Execution Log Navigation
The menu on the left side of the run log screen can be used to navigate within the listed entries in the selected run log. These navigation options are particularly useful for longer run logs.
 – view log entries from the beginning of the run
  – view log entries from earlier in the run than the currently displayed entries
  – view log entries from later in the run than the currently displayed entries
  – view log entries from the end of the run
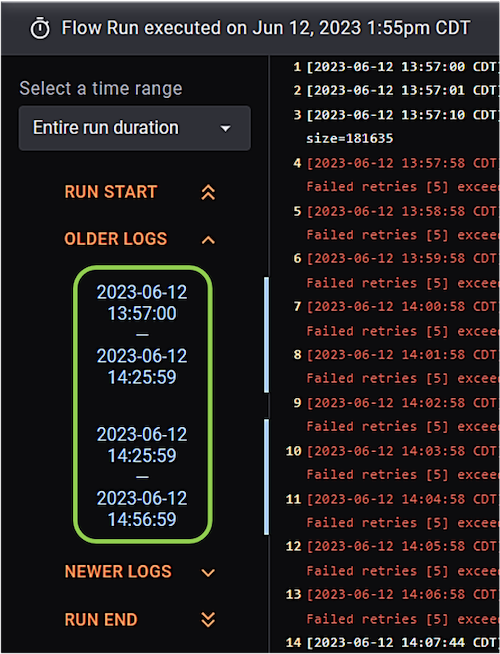
For some longer run logs, additional time-span options are available in this menu. Click a listed time span to navigate to run entries corresponding to that time span.
The Select a time range pulldown menu on the left can be used to navigate to other run logs corresponding to the selected data flow or, for streaming data flows and/or those with longer run times, among entries within the selected run log.
To navigate to entries within the selected run log corresponding to a time range relative to the current time, select an option under "Relative time ranges".
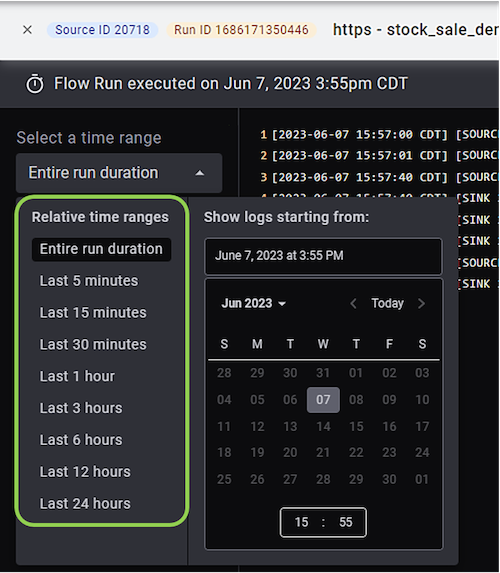
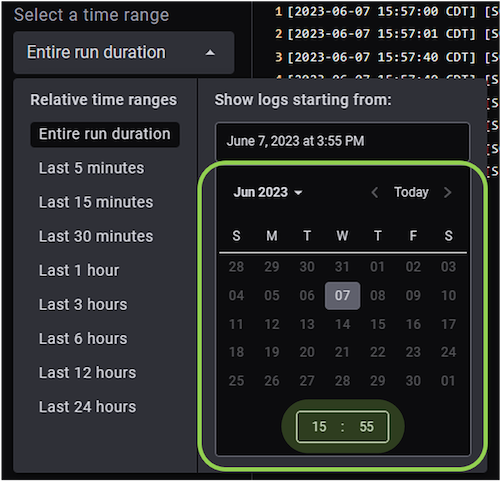
To navigate to run log entries from a specific datetime, select the date from the calendar, and enter the start time (24-h format) of the run in the field below the calendar.
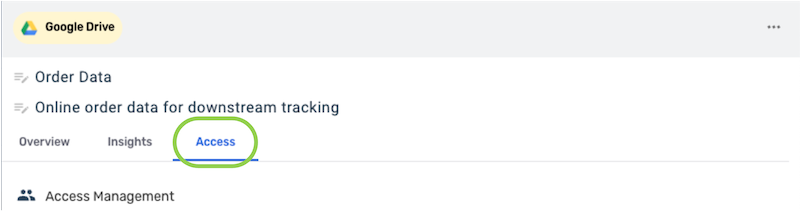
4. Access Tab
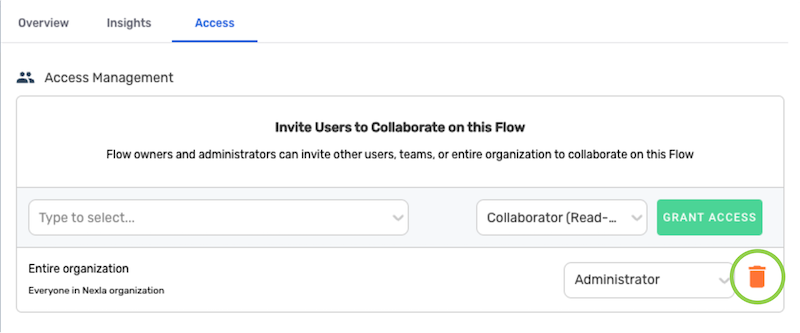
The Access tab provides access management options for the selected flow to facilitate sharing and collaboration, as well as a list of any users with whom the flow is currently shared and their access type(s).
Users with owner or administrator access to the data flow can share it with another user, a team, the entire organization, or an email or email group from the Share tab.
To share the data flow, select the recipient user, group, or email address from the pulldown menu on the left.
noteUsers with collaborator access to the data flow cannot share it with other users and will see the message "You have read-only permissions for this Flow".
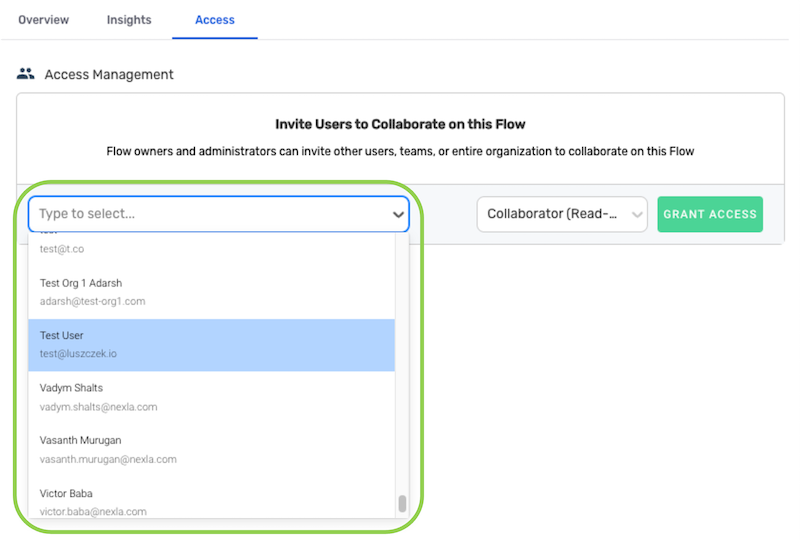
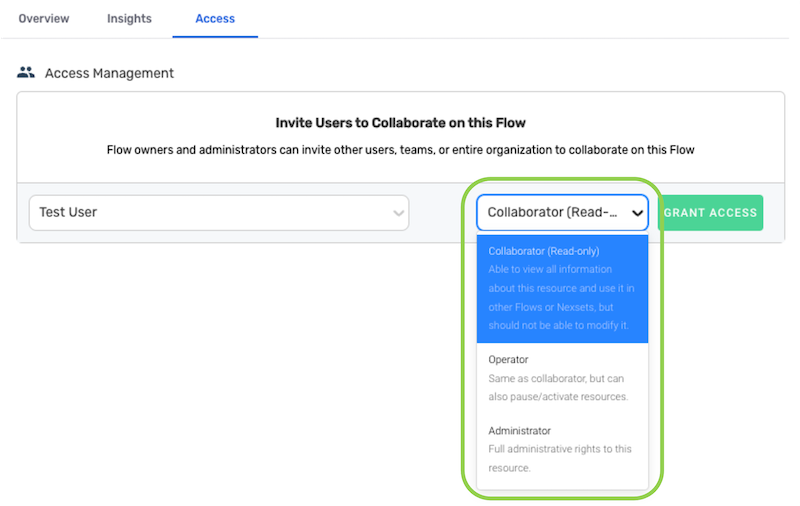
Use the pulldown menu on the right to select the level of access to the data flow that will be granted to the user(s).
Access LevelsFor more information about resource access levels that can be granted to users in Nexla, see Resource Access Levels.
Click the
 button to share the data flow according to the selected user(s) and access level.
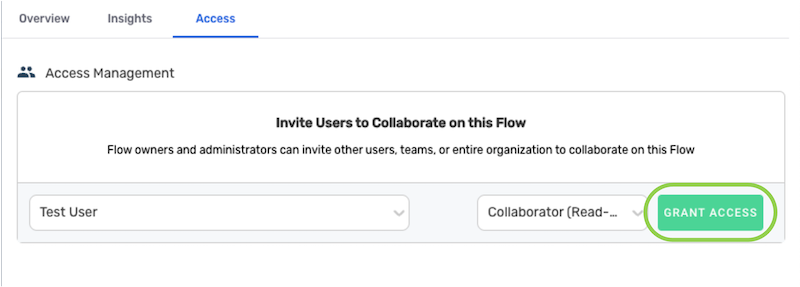
At the bottom of the Access tab, any user(s) with whom the selected data flow has previously been shared are listed, along with their access level(s).
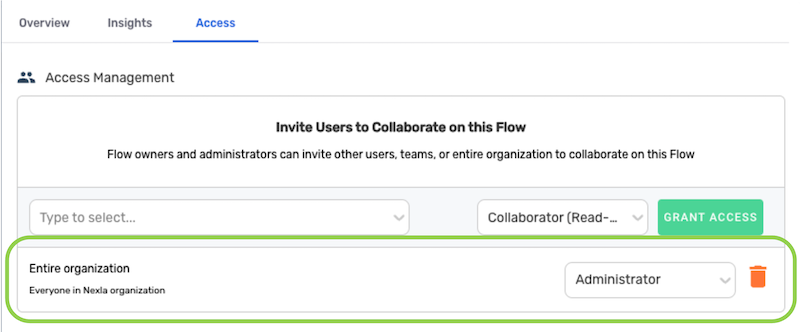
To remove access to the data flow from a listed user or group, click the
 icon on the listing.