Data Source Information
This article describes how to access the Data Source Information screen for any data source in Nexla. Additional sections explain the different types of information and associated options provided in this screen.
1. Open the Data Source Information Screen
On the toolbar on the left side of the screen, click
 to open the Sources screen.
Click on a source in the list. This will open a side window containing the Data Source Information screen for the selected source.
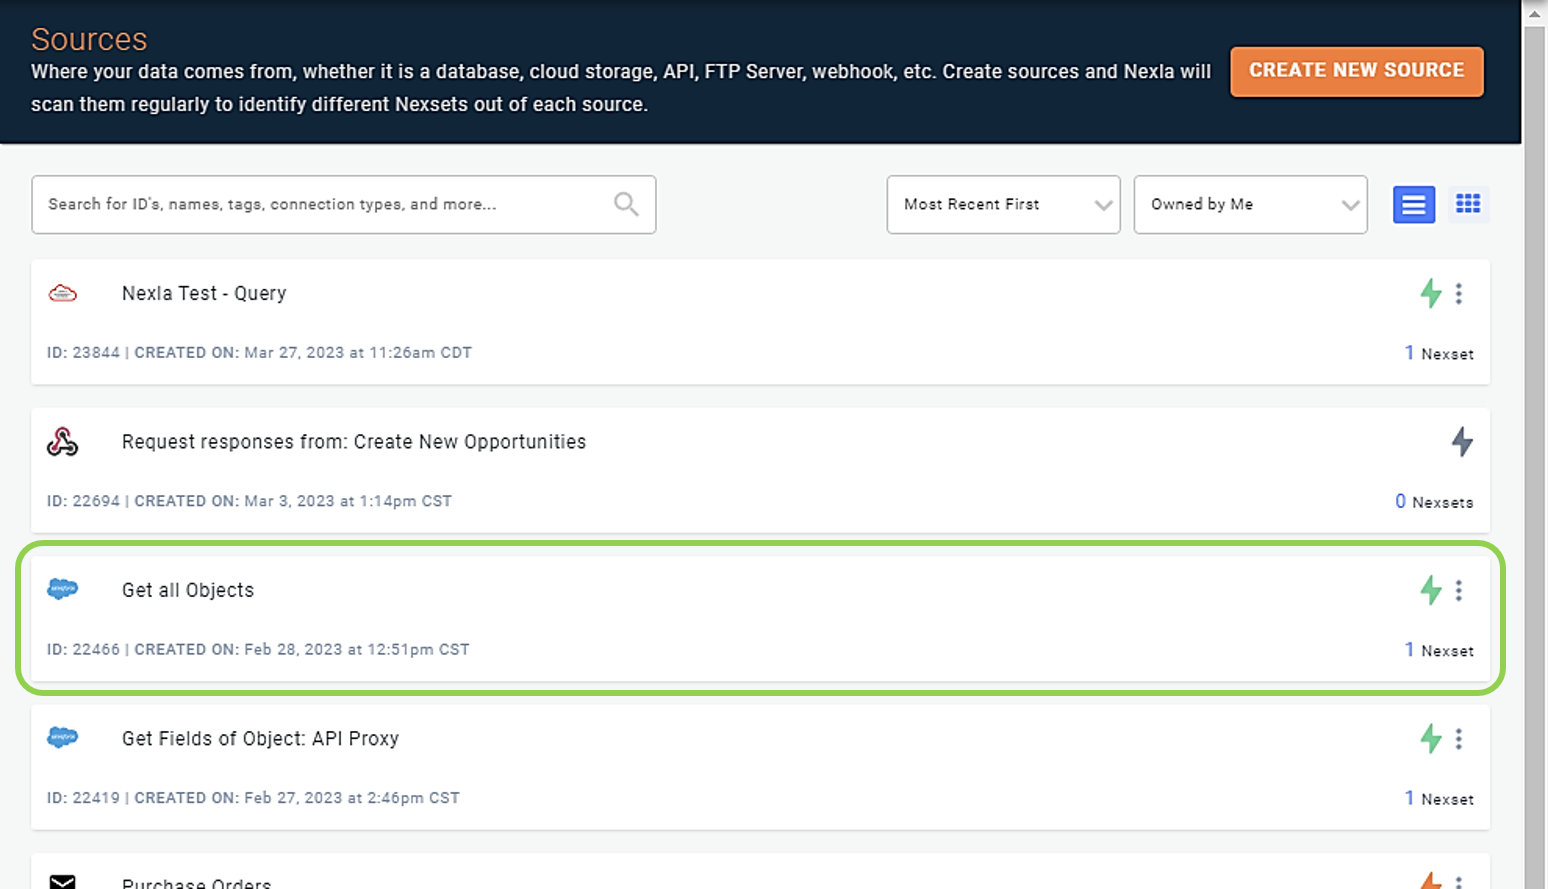
The subsequent sections explain the types of information and options available in each part of the Data Source Information screen.
2. Data Source Name & Description
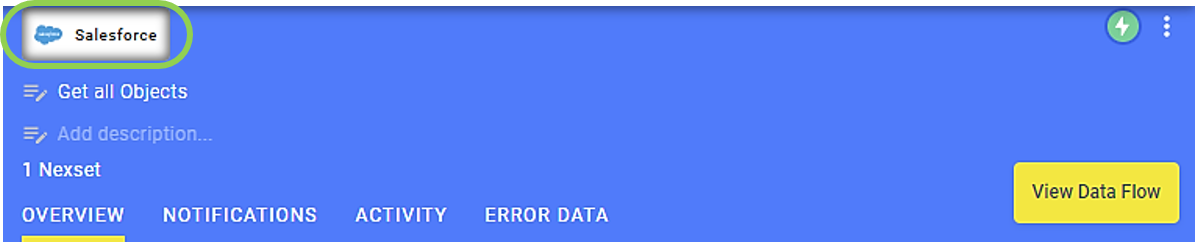
At the top of the Data Source Information screen, the name and description of the selected data source is displayed, along with additional information about the source. This section describes how to edit the data source name and description from this screen and explains the additional information available in the top panel of the Data Source Information screen.
The tile at the top left of the panel indicates the connector type used for the data source.
To edit the name of the data source, click on the name field near the top of the panel, and make any desired modifications. Changes will be automatically saved.
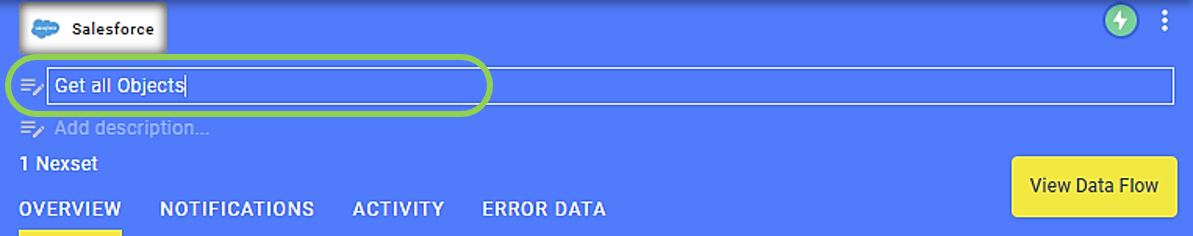
To add a description of the data source, click on
 , and enter the descriptive text. To edit an existing data source description, click on the description, and make any desired modifications. Changes will be automatically saved.
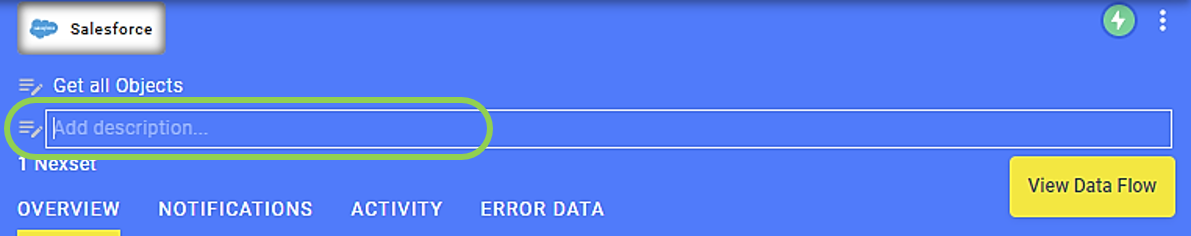
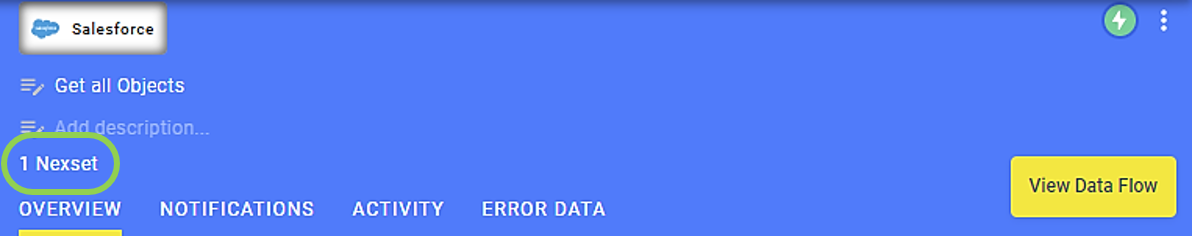
The number of Nexsets detected by Nexla from the selected source is displayed below the data source description.
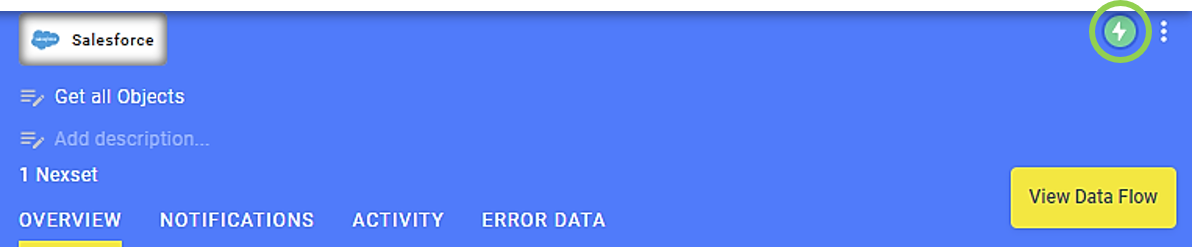
The icon displayed in the top right corner of the panel indicates the current status of the data source in Nexla.
The
 icon indicates that the source is active.
 The
 icon indicates that the source is paused.
To access a dropdown menu of functions related to the selected data source and the associated data flow, click
 in the top right corner of the panel.
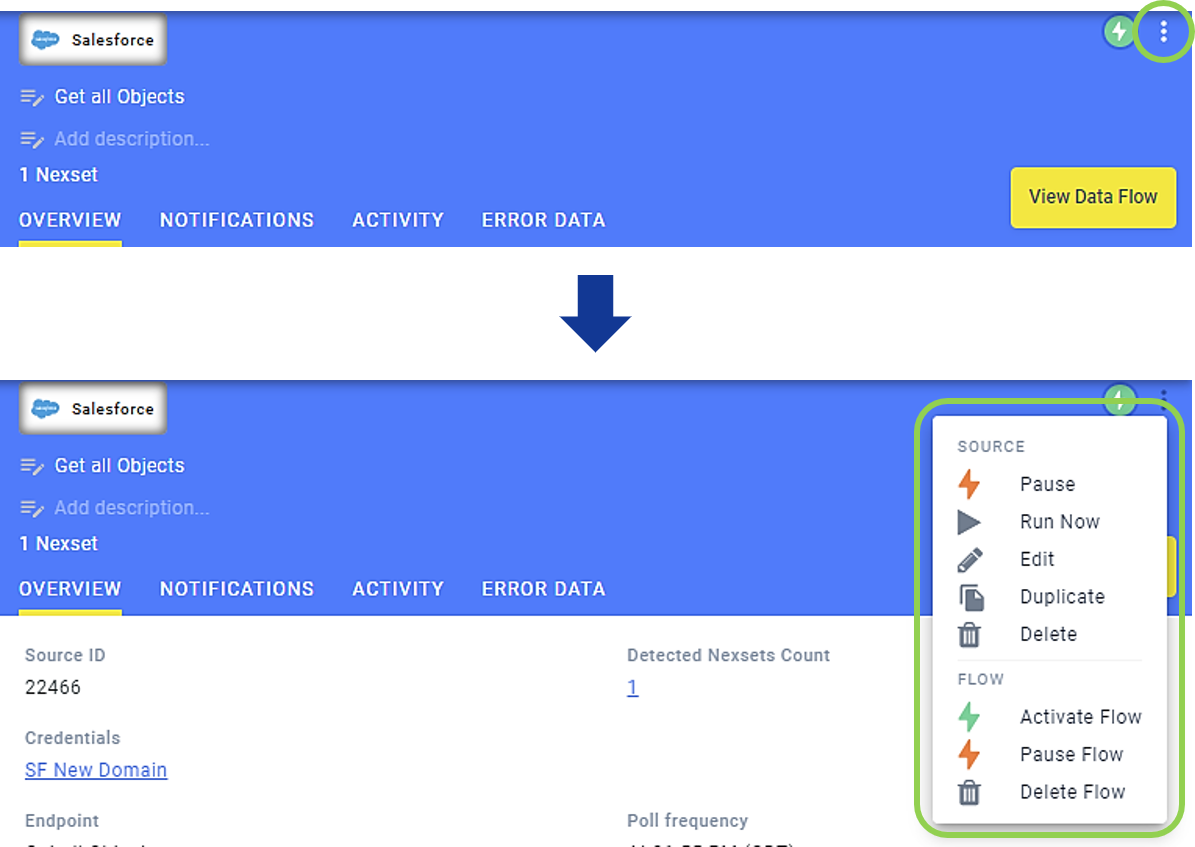
Click
 to view the entire data flow chain associated with the selected source in the My Data Flows screen.
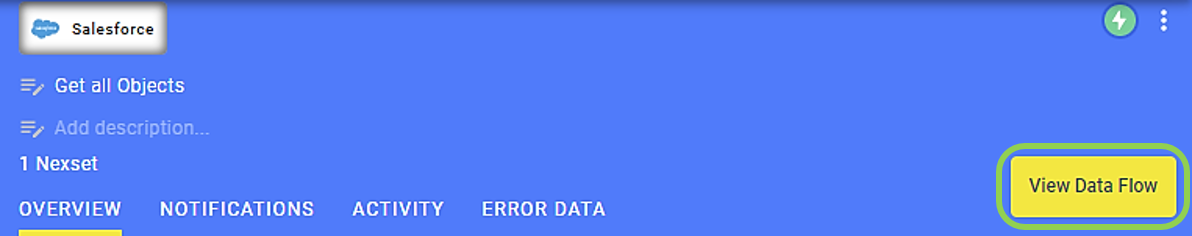
3. Overview Tab
The Overview tab displays general information about the selected data source and allows users to attach data source tags that provide additional useful information about the source.
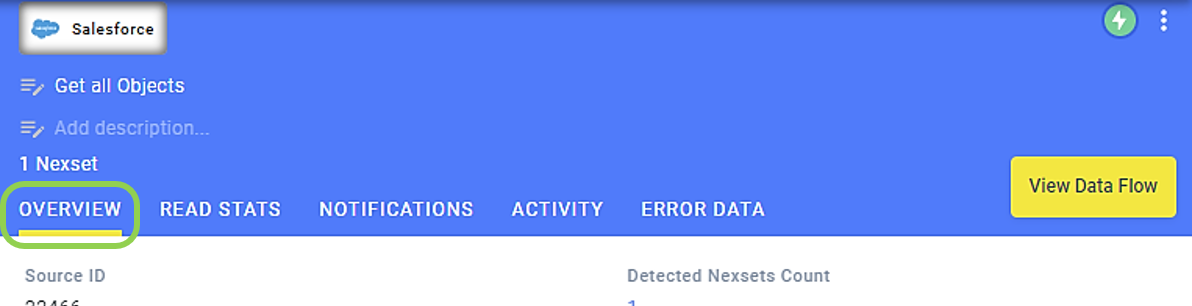
The panel at the top of the Overview tab provides the following general information about the data source:
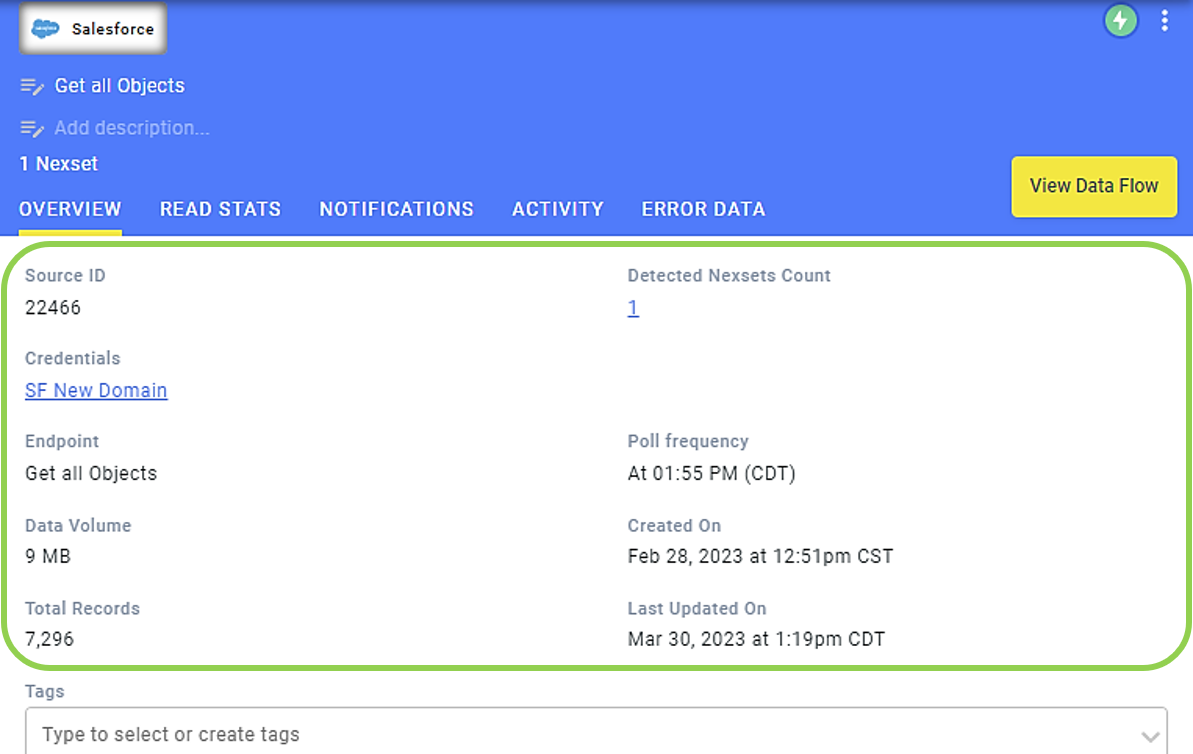
Source ID – This is the ID associated with the data source in Nexla.
Detected Nexsets Count – This is the total number of Nexsets detected by Nexla from the data source.
Credentials – This is the credential used to connect Nexla to the data source, if any.
If no credential was required to connect Nexla to the selected data source, this category will not be shown.
- Click on a listed credential to open it in the Credentials screen.
Data Volume – This is the total volume of data ingested by Nexla from the data source.
Total Records – This is the total number of data records ingested by Nexla from the data source.
Created On – This is the date and time at which the data source was added in Nexla.
Last Updated On – This is the most recent time that Nexla checked the data source for new data.
Additional categories – Additional information specific to the selected data source type and connection is also displayed in this panel, which can include information about the endpoint, poll frequency, schema and schema settings, file format, data detection mode, data fetching mode, any selected tables and/or databases, etc.
The Tags menu located near the middle of the panel can be used to attach tags providing information about the data source, such as its intended use, connection and/or credential information, associated data flows and processes, etc.
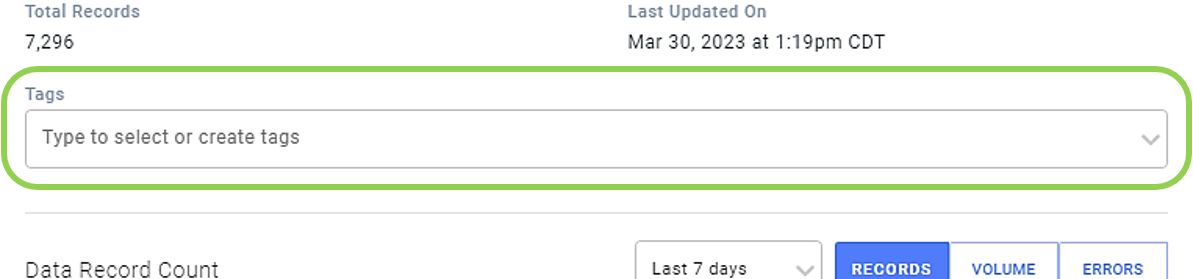
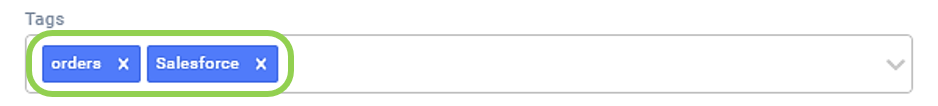
Any tags that have been previously applied to the selected data source are shown in the Tags field.
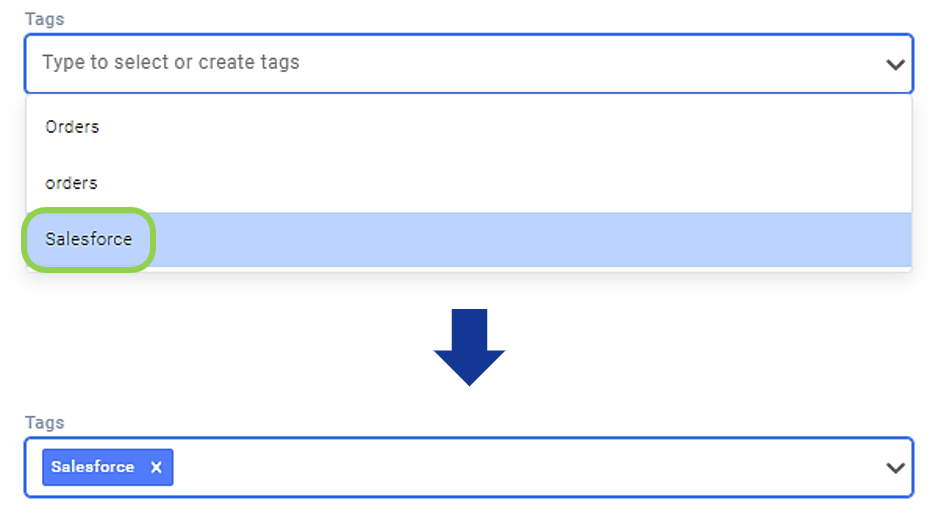
To apply a tag previously used in the Nexla account to the selected data source, select it from the list in the Tags pulldown menu.
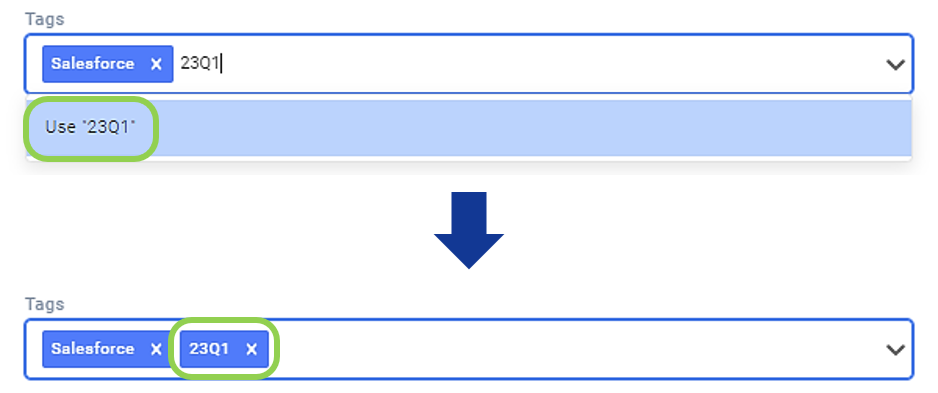
To add a new, unlisted tag to the data source, type the tag text in the Tags field, and click on the "Use '\<entered text>'" listing that appears in the pulldown menu.
To remove an applied tag from the selected source, click the
 icon on that tag listed in the Tags field.
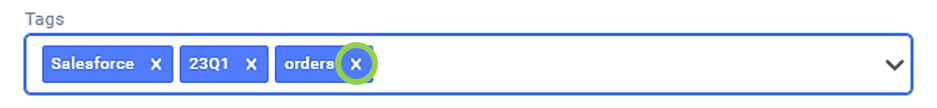
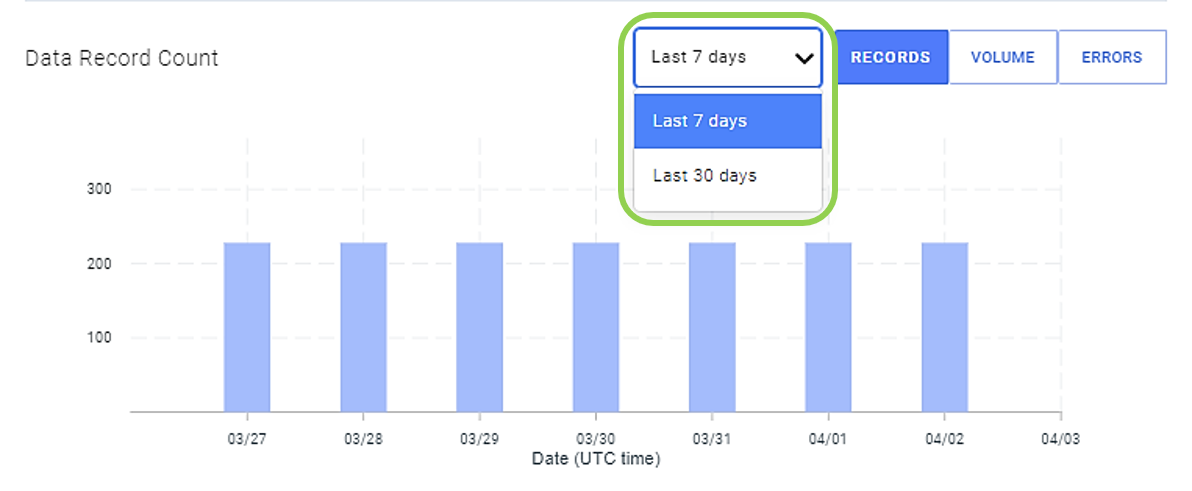
The lower panel in the Overview tab provides numerical information about the data records, data volume, and data errors detected from the selected source over time.
All of the information provided in this panel can be viewed covering the last 7 days or last 30 days by selecting the corresponding option from the pulldown menu indicated below.
To view a graph of the total number of data records ingested from the selected data source by date, select the
 button on the right.
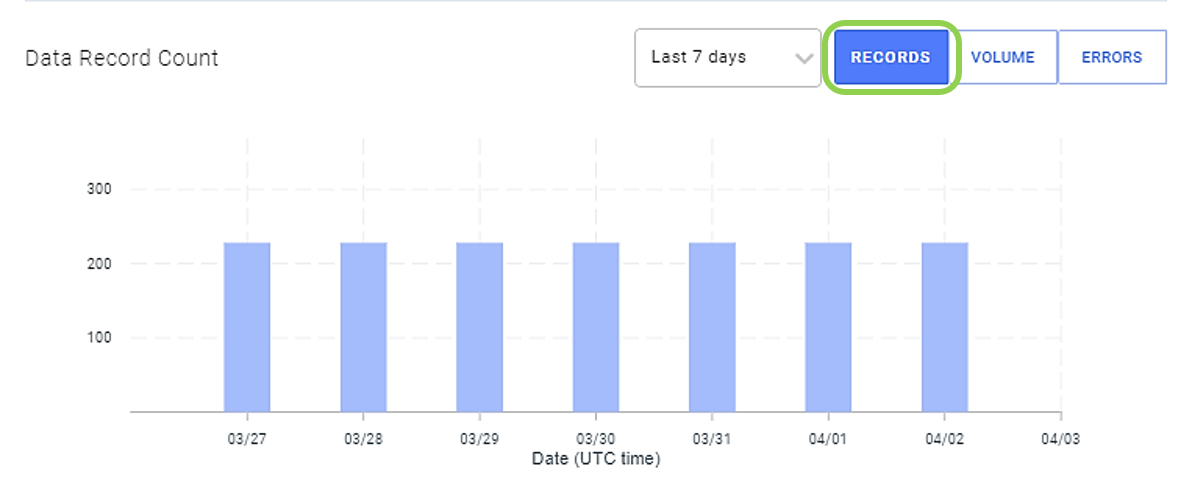
To view a graph of the total data volume (shown in bytes) ingested from the selected data source by date, select the
 button on the right.
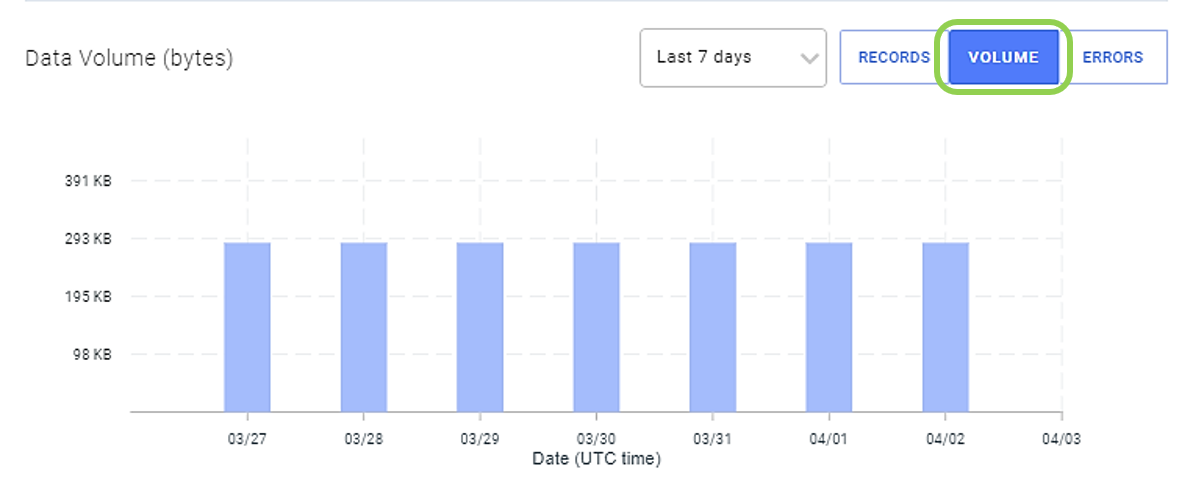
To view a graph of the total number of data errors in the selected Nexset by date, select the
 button on the right.
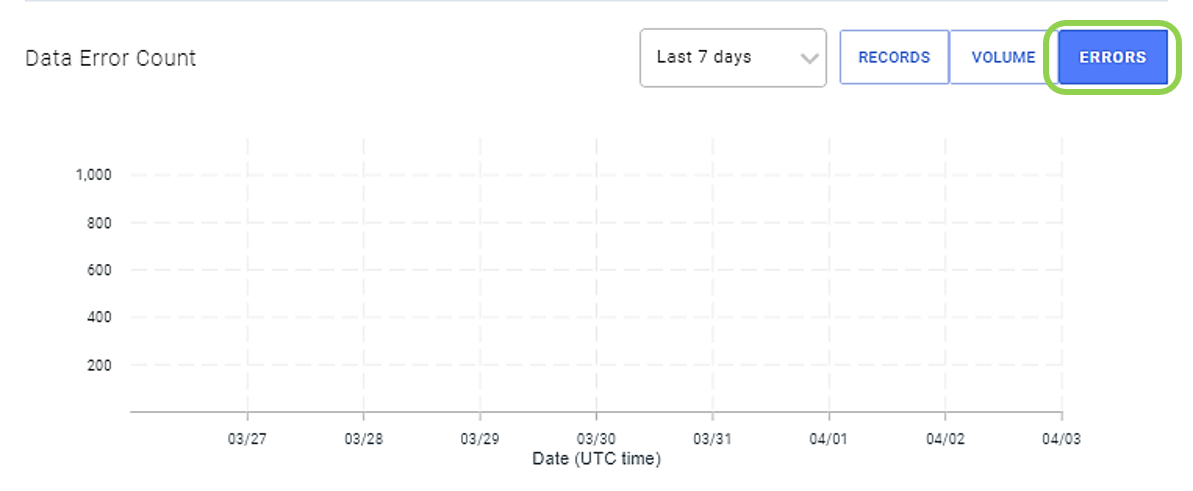
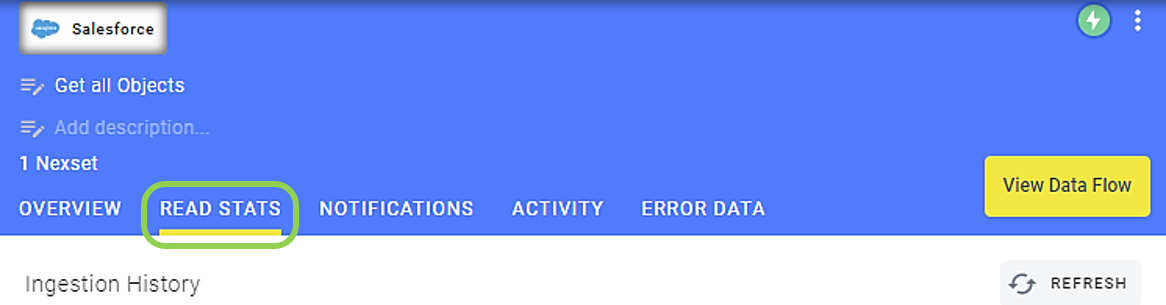
4. Read Stats Tab
The Read Stats tab displays the ingestion history for the selected data source in Nexla. This includes the scan data and time, number of ingested records and/or errors, total data volume ingested, and the Nexset in which the scanned records were included for each scan.
The date and time of each scan is displayed on the left side of the Ingestion History list.
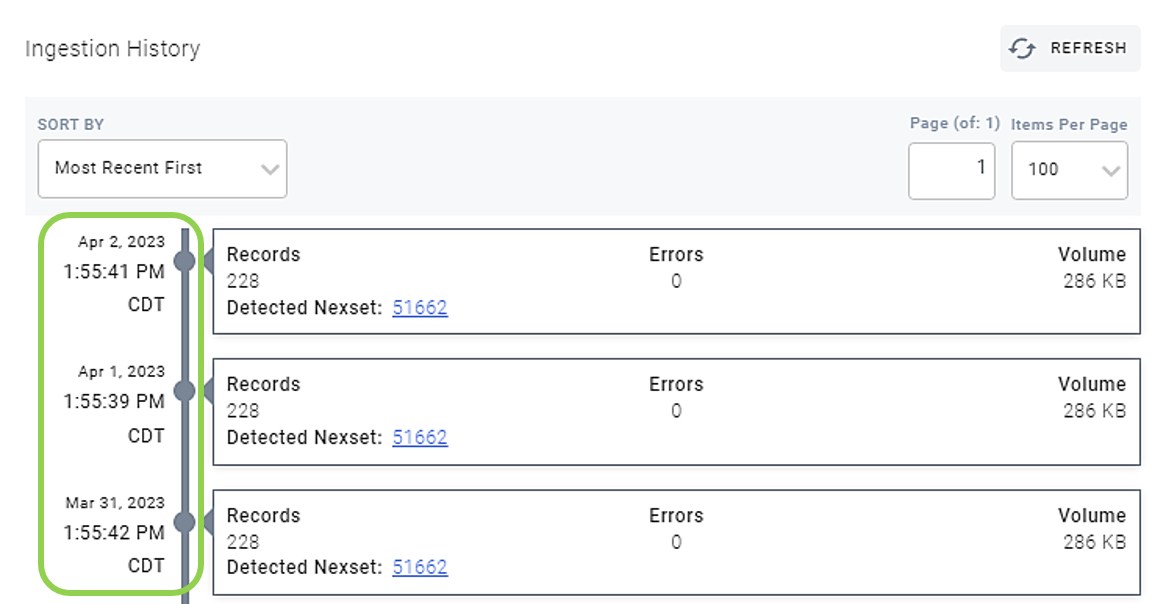
For each time that the data source is scanned by Nexla, the Ingestion History displays the following information:
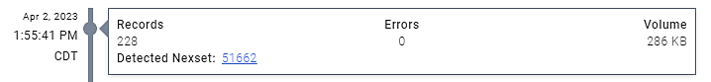
Records – the total number of data records ingested during the scan
Errors – the total number of data errors that occurred during the scan
Volume – the total data volume ingested during the scan
Detected Nexset – the ID of the Nexset in which the records detected during the scan were included
- Click on a listed Nexset ID to view it in the My Nexsets screen.
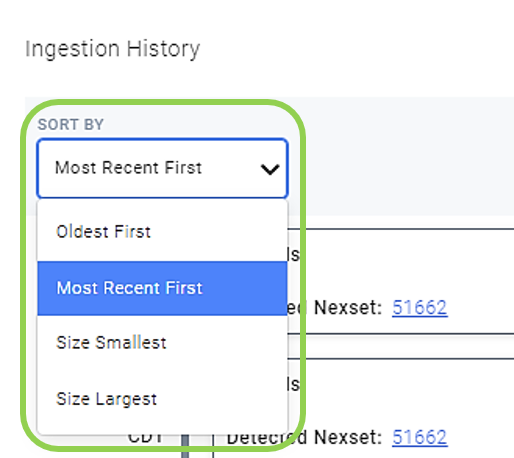
To choose whether the Ingestion History display is sorted by most recent scans first, oldest scans first, smallest size first, or largest size first, select the corresponding option from the Sort By pulldown menu on the left.
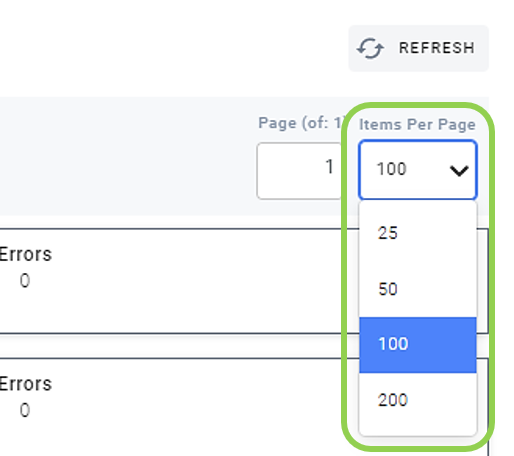
To change the number of notifications shown on each page, select the desired option from the Items Per Page pulldown menu on the right.
To refresh the Ingestion History to include any new scans that have occurred, click the
 button at the top right of the Read Stats tab.
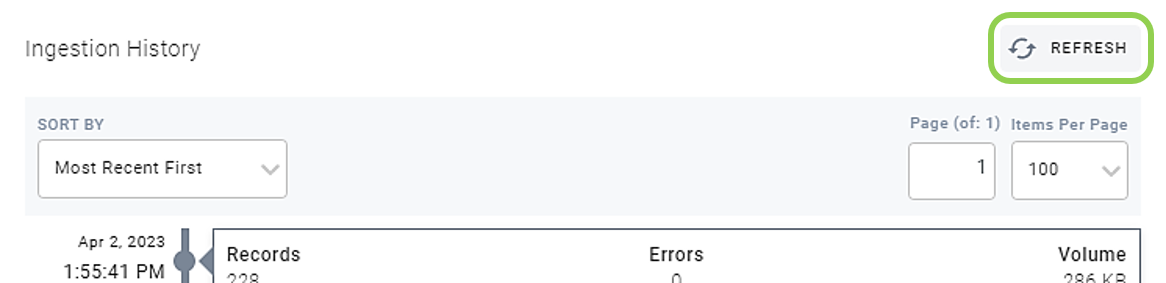
5. Notifications Tab
The Notifications tab displays notifications about platform activity, system alerts, and data alerts related to the selected data source. It also provides a link to access notifications settings for the data source.
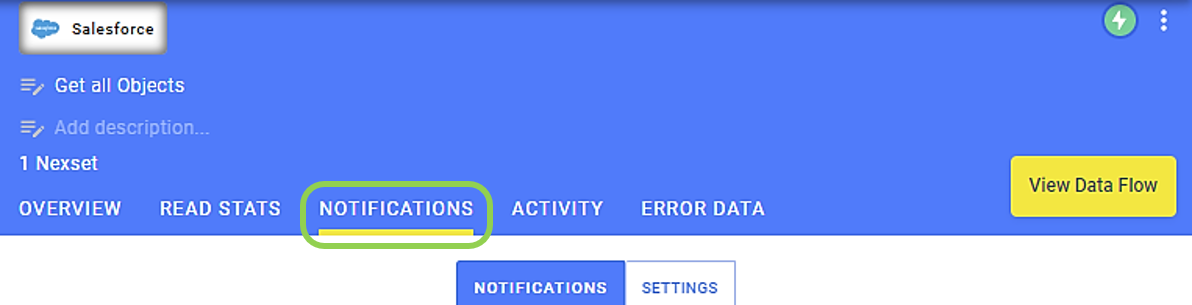
When
 is selected at the top of the Notifications tab, all notifications related to the selected data source will be displayed. New notifications are displayed with a blue background.
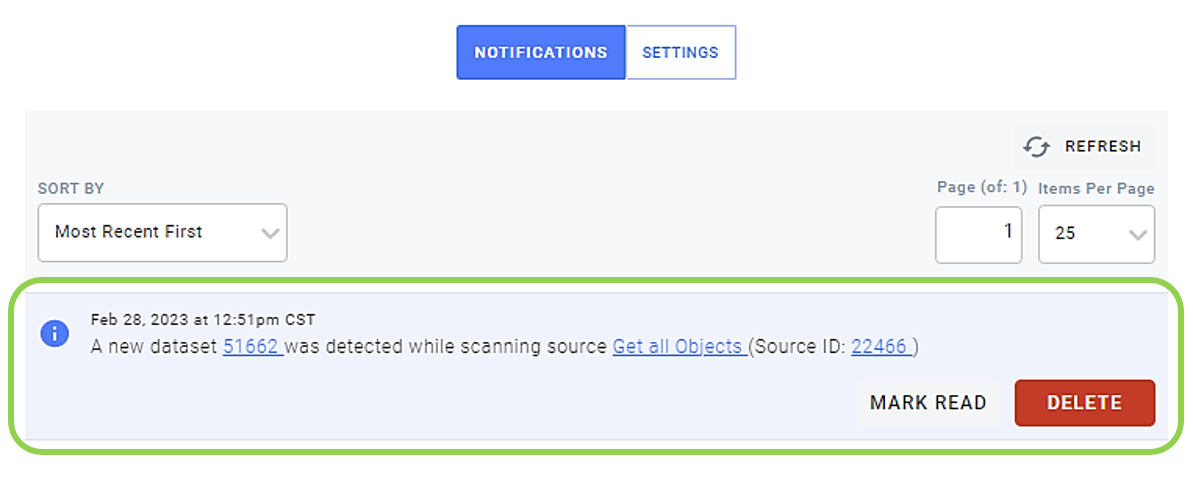
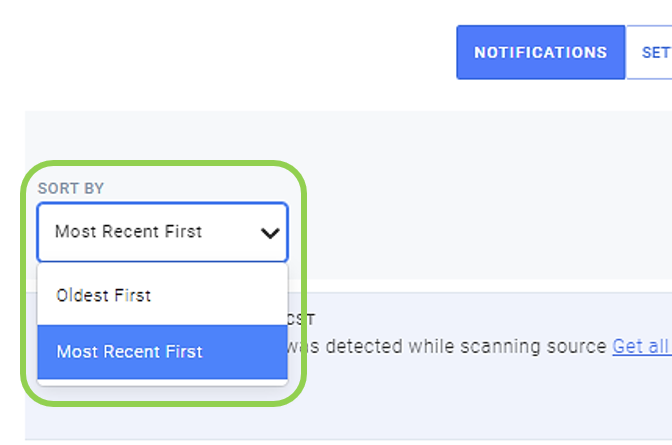
To choose whether the listed notifications are displayed in the order of most recent first or oldest first, select the corresponding option from the Sort By pulldown menu on the left.
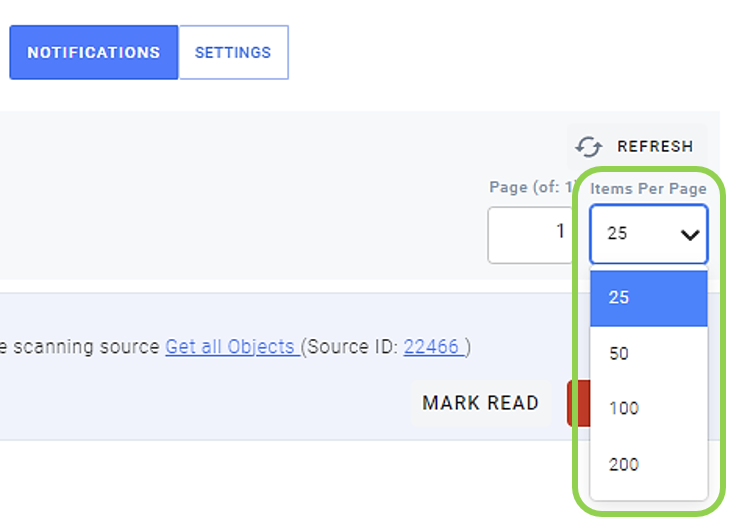
To change the number of notifications shown on each page, select the desired option from the Items Per Page pulldown menu on the right.
To mark a notification as read, click the
 button on the right side of that notification. Notifications marked as read are shown with a white background.
 To remove a notification from the list, click the
 button on that notification.
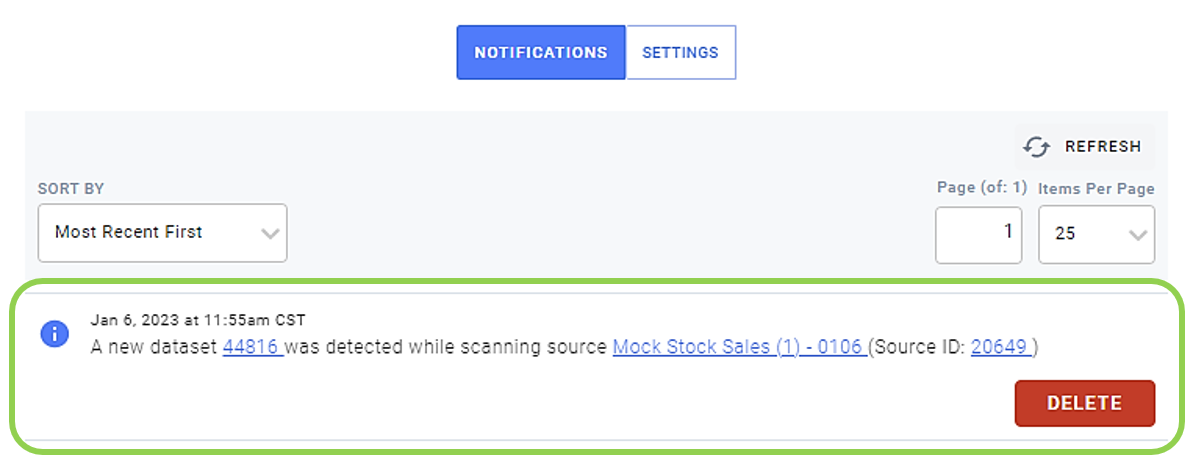
To refresh the list of notifications, click the
button in the top right corner of the notifications list. 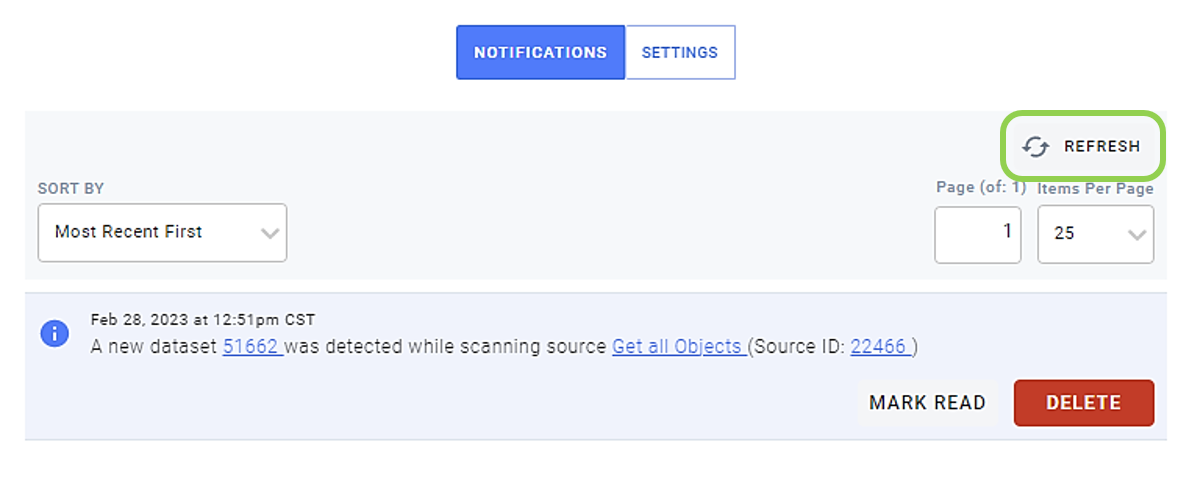
To access notification settings, select
 at the top of the Notifications tab.
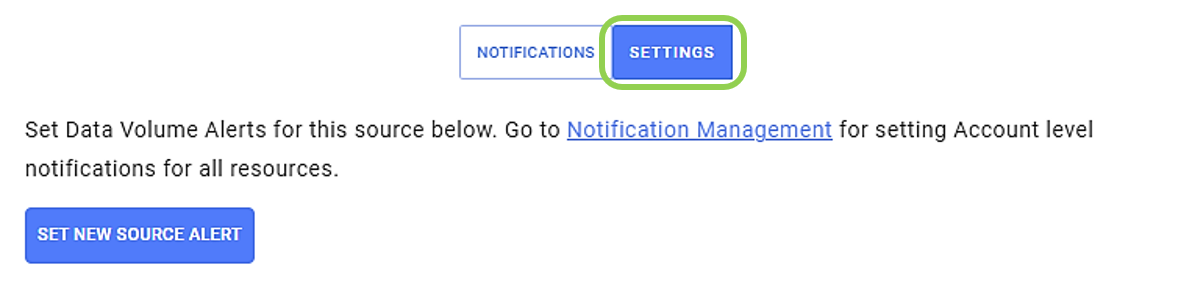
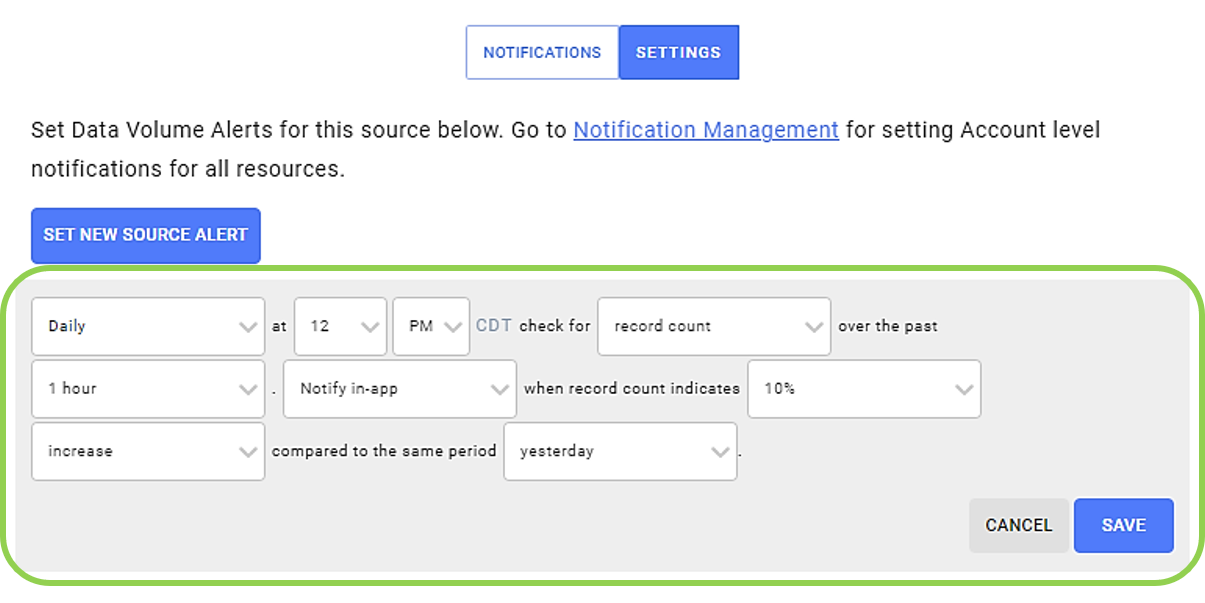
To create a new source data alert for the selected source, click
 to open the source data alert creation panel.
 Source data alerts can be used to configure Nexla to notify users of changes in data volume and/or ingestion delays for the source.
For more information about source data alerts and how to set them up, see the Help Center article Source Data Alerts.
Click
 to access the Notification Management screen, where account-wide notification settings can be configured.
 For more information about all types of notification settings in Nexla, see the Help Center article Nexla Notification Settings.
To learn more about the different types of notifications available in Nexla, see the article Nexla Notification Types.
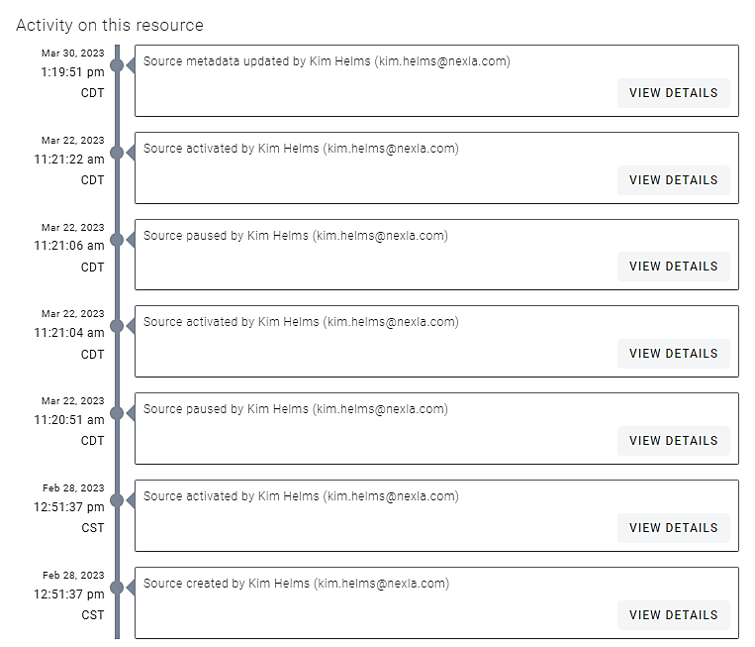
6. Activity Tab
The Activity tab displays all creation, modification, and activation actions that have occurred for the selected data source.
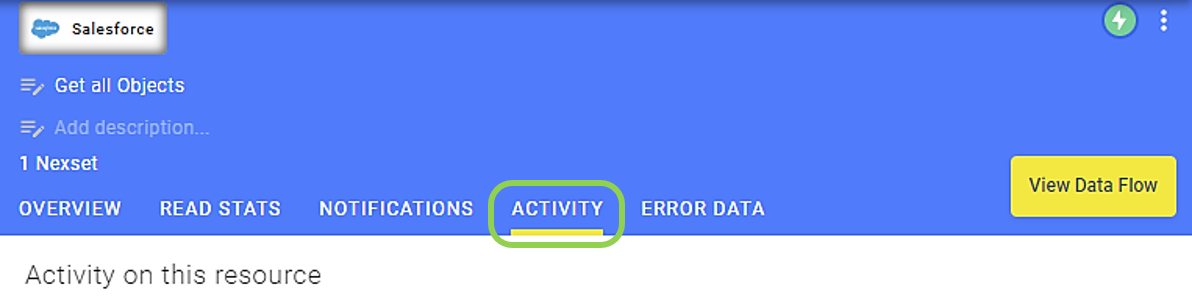
The information displayed in the Activity tab includes the date and time at which any actions occurred and the Nexla user(s) who performed the actions.
To view additional details about a listed action, click the
 button to the right of that action.
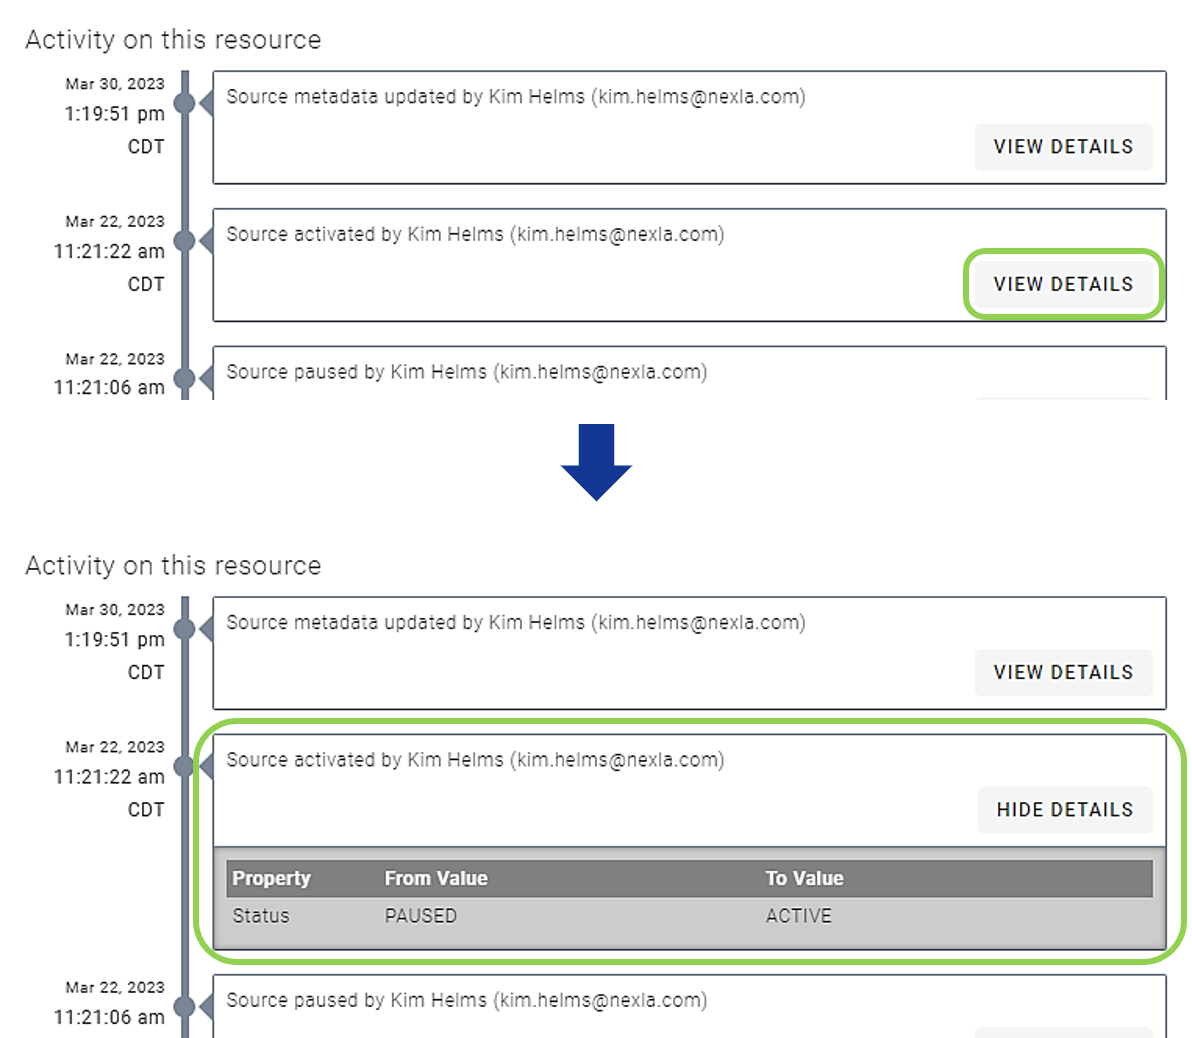
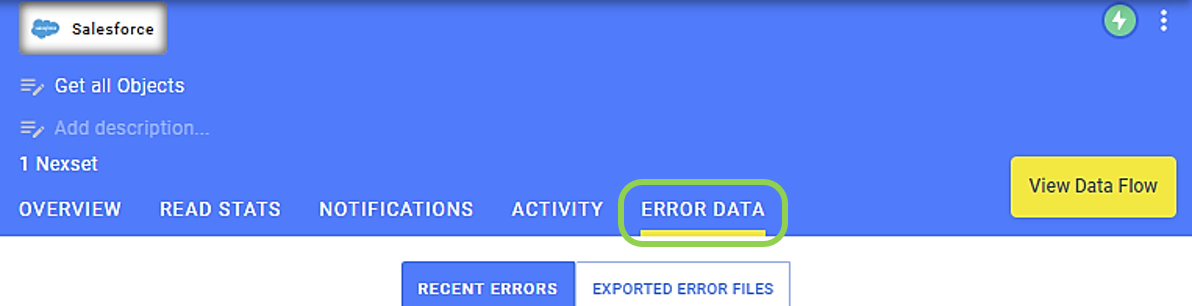
7. Error Data Tab
The Error Data tab displays any data-processing errors that have occurred for the selected data source.
When
 is selected at the top of the Error Data tab, any record-processing errors that have occurred within the most recent 72 hours will be listed below.
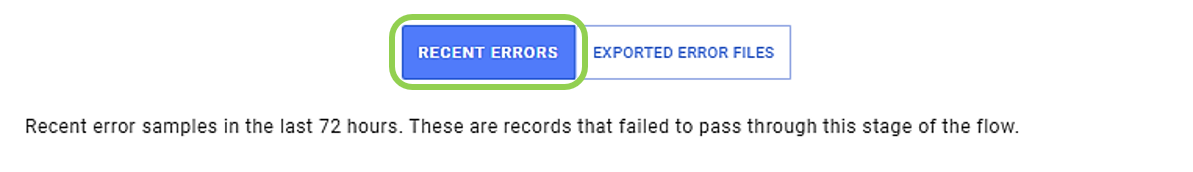
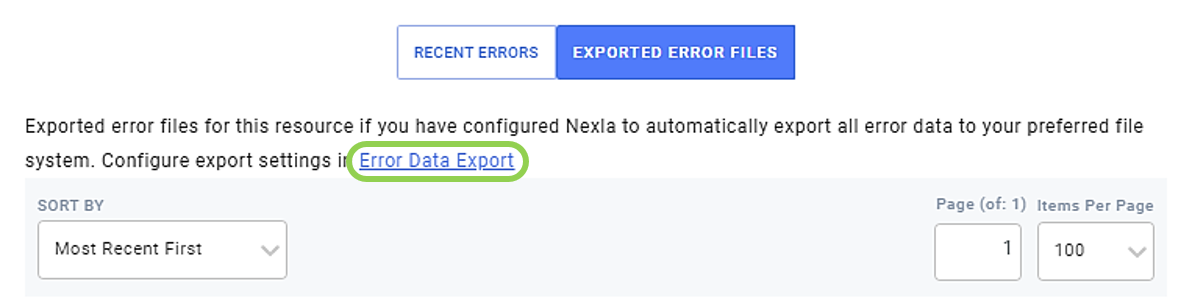
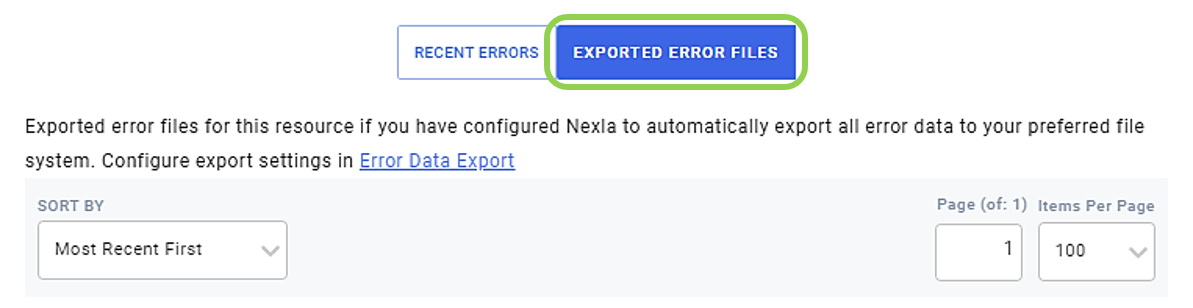
When
 is selected at the top of the Error Data tab, any error reports that have been exported for the selected Nexset will be displayed below.
 Exported errors will only be displayed if automatic error data exporting has been set up for the associated Nexla account.
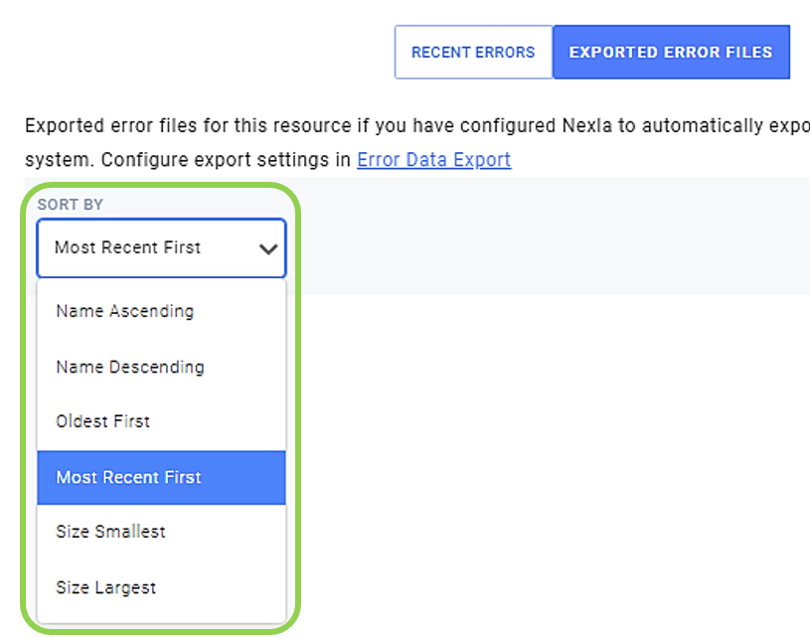
To change the order in which exported errors are shown, select an option from the Sort By pulldown menu on the left.
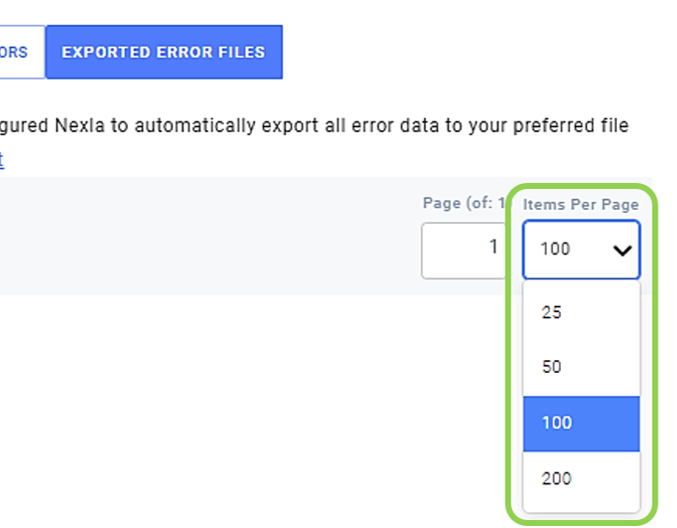
To change the number of errors shown on each page in this view, use the Items Per Page pulldown menu on the right.
To view and/or configure error data export settings in Nexla, click
 to open the Error Data Export settings screen.